Jesus inspired me to draw this by hand to explain what is happening with a transaction on LUNC because of the taxes.

I am breaking it down into parts and explaining though it’s quite clear.

The first part shows that the transaction (as an example) starts when:
Market Cap = $ 1 billion
Circulating Supply = 6.5 Trillion
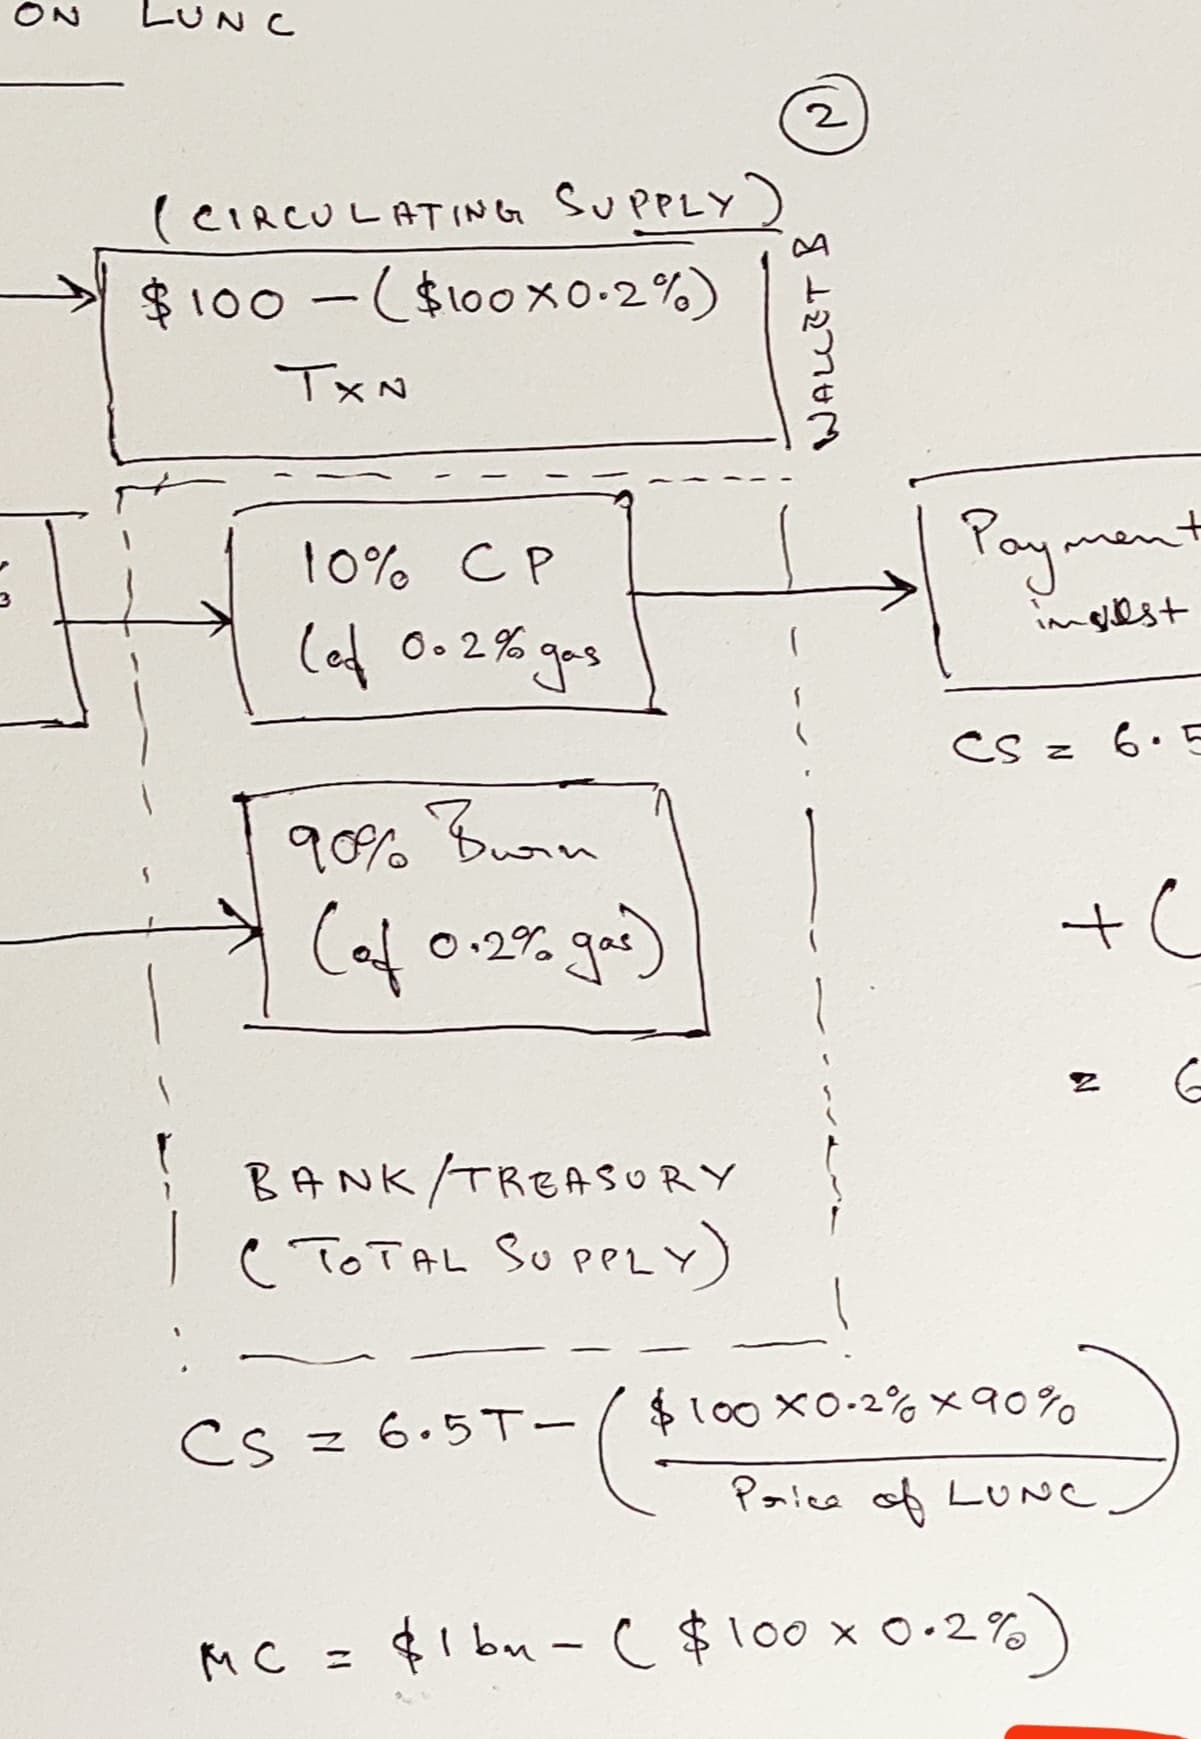
The second part is also self - explanatory considering 0.2% taxes/gas/whatever you wanna call it.
That’s split into 2 parts:
10% to Community Pool
90% to Burn
I am just writing Burn here cause even if this is going to OP, the same thing that is happening in this diagram will happen there, so for sake of simplicity, just consider that it’s burnt for the time being.

Now let’s come to the last part which is obviously the most important part.
You can see what happens here when CP is taken out.
For sake of simplicity I am considering that the entire 10% is taken out though this actually happens over a period (and which is why you guys can’t see it in the data by eye).
Please note that I haven’t even considered that the same happens to the rest of the 90% also, but forget that for the time being.
Now see for yourself what happens now.
Basically you have already removed the Market Cap while removing the supply. So we all know what’s gonna happen after that to the price per LUNC.
Obviously this is a simplistic explanation since the market cap could increase or decrease.
Say it doesn’t increase, and it decreases.
I think you can understand what happens to this calculation then.
Now apply the same thing to the OP if the 90% had not been burnt and had gone to the OP only to be withdrawn 21 days later.
This is probably my simplest post yet on Agora so it should be easy to understand.
This is not your post @JESUSisLORD so you can reply here and write whatever you want freely
@godoal please check whether I am correct or not
P.S. Avoid the semantics for the time being while discussing this. Apologies for the bad drawing skills and handwriting.
